by: Grebner
Thu Nov 13, 2008 at 01:30:53 AM EST
(Bumped on account of getting the graphic stuff fixed. – promoted by Eric B.)
Continuing my discussion of how people actually use absentee ballots, we have (more or less) final data from the 11/4/08 election. As you can see, there was a noticeable surge of ballots returned Monday before the election. Because the data comes from the Secretary of State, and they cut the final file about noon of Election Day, it seems likely that the final percentage was even higher than 92%.
[Edit: the folllowing caption is wrong – it should read “Cumulative Ballot Return Rate”. The actual caption is embedded in a JPEG, so it can’t be corrected easily.]
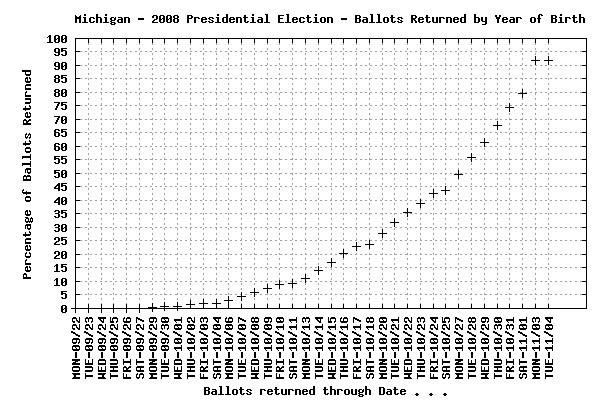
As you can see, very few ballots were returned more than four weeks before the election. The number of ballots returned each day rose gradually and smoothly as election day approached.
The conventional wisdom among campaigns – that many people vote their ballots and return them immediately after they receive them – simply isn’t true. With such a long and complicated ballot, the general response is to hold back and ponder, in the face of the gradually increasing pressure imposed by the calendar.
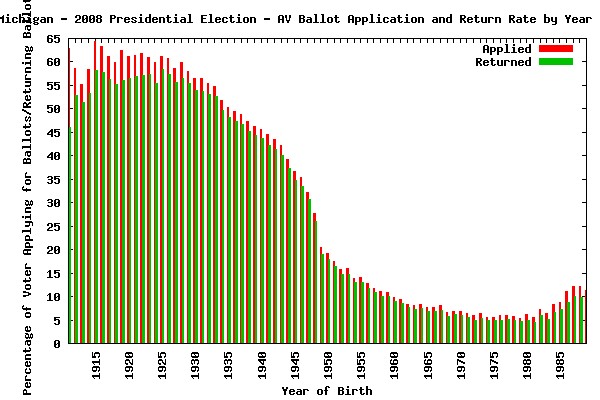
Here’s a different vantage point: the fraction of all voters who applied for/returned absentee ballots. Because of technical problems with the data, the graph understates the rate by about 10%, but the shape of the curve is accurate.
Notice that among the very elderly – say over 80 years old – the application rate is over 60%, but the number of ballots returned tops out at about 55%. Among the “younger old” (say, 65-ish), fewer people apply for absentee ballots, but almost all are returned.
There is a very steep drop for people born after 1948, because Michigan doesn’t provide an automatic right to an absentee ballot to people under the age of 60. The application rate continues to drop until we get to the very youngest – college age – where it rises abruptly. But notice the large number of the college-age ballots which are never returned. (The length of the red bars above the green.)
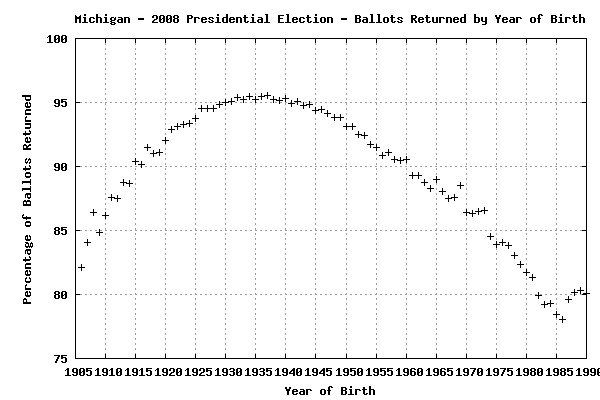
Here’s another view of the data, focusing solely on the percentage of all issued ballots which had been returned by noon of election day. That percentage tops out over 95% among people aged 65 to 75, with lower rates for the very old (who tend to be in poorer health) and the younger (who have less experience with absentee voting).
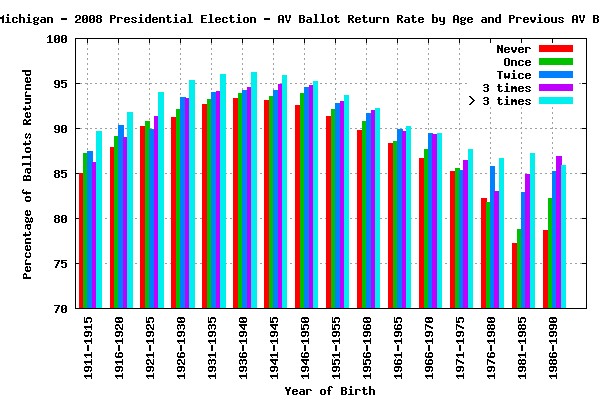
Finally, I looked at the combination of age and previous absentee voting experience, which makes it very clear that failing to return an absentee ballot is a function both of age and experience with absentee voting.
As you can see, among people in their prime voting years who are familiar with absentee voting, virtually all ballots get returned. The final rate is probably above the 97% shown here, if we account for ballots returned on election day, people who moved away and re-registered after applying for an absentee ballot, and so forth.
But there are large numbers of ballots which are simply never returned, by voters who are older, younger, or inexperienced with absentee voting.
The lesson for GOTV is obvious: it’s great to get people to apply for absentee ballots, but we can’t afford to end our effort at that point. Among certain segments of the population, as much as 20% of the ballots will never be returned, unless there is well-directed follow-up.
The caption should read: Absent Voter Ballot Return Rates, by year of birth and previous absentee ballot use. (It’s a new graphics package, and I’m still learning.)
Leave a Reply